


Ghana
Forest resources and context of Ghana
According to the FAO (2020) Ghana has around 7;9 million hectares of forested land, which constitutes to 35.0% of the total land area. Around 7.6 million hectares are primary or otherwise naturally regenerated forest, and around 297 thousand hectares are planted forest.
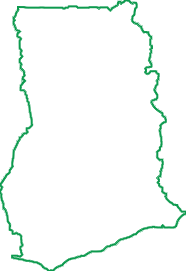
Land surface
22.8million ha
Forest cover
7.9million ha
Production forest
1.5million ha
Forest ownership
100% publicly
Forest lost
xxx
ha/year
Forest resources in Ghana
Types of forest
The Ghanaian forests broadly fall into two vegetation zones, each with different vegetation and forest types: the High Forest Zone in the South covering 34% and the Savannah Zone in the North covering 66% of the land area (MLNR, 2012).
According to the FAO (2020) Ghana has around 7;9 million hectares of forested land, which constitutes to 35.0% of the total land area. Around 7.6 million hectares are primary or otherwise naturally regenerated forest, and around 297 thousand hectares are planted forest. Ghana has approximately 2.6 million hectares of forest reserve land, of which 1.6 million hectares falls within the so-called High Forest Zone. Of these reserves 715,000 hectares have been dedicated for natural timber production, with the remainder under protection and plantation development. Apart from these reserves approximately 500 thousand hectares of unreserved forests as well as a further 2 million hectares of crop land also produce timber.
Forest ownership in Ghana
The ownership of the Ghanaian forest area can be divided among public land, stool land, family land and private land. However, the management of all forest resources including timber harvesting rights are administered by the Forestry Commission for benefit of the land owners. The management responsibilities of the Forestry Commission in relation to off-reserve forest resources are more limited as in relation to on-reserve areas. In off-reserve areas the Forestry commission is responsible for regulating, as opposed to managing, the utilization of forest and timber resources (ClientEarth, 2013a).
Need to analyse deforestation risk at plot level? — WHISP
Open Foris Whisp (“What's in that plot?”) is a free and open-source solution developed by the Food and Agriculture Organization (FAO) to support rapid, plot-level analysis of land use and deforestation risk. It combines geospatial datasets and satellite-based information to provide transparent insights for a specific location, helping users understand whether the area is forest, agricultural land, or potentially linked to deforestation or disturbance.
WHISP uses GPS points or plot polygons to perform an analysis based on multiple public datasets on forests and land use.
The aim is to identify plots that may present a potential deforestation risk and those for which further checks may be necessary.
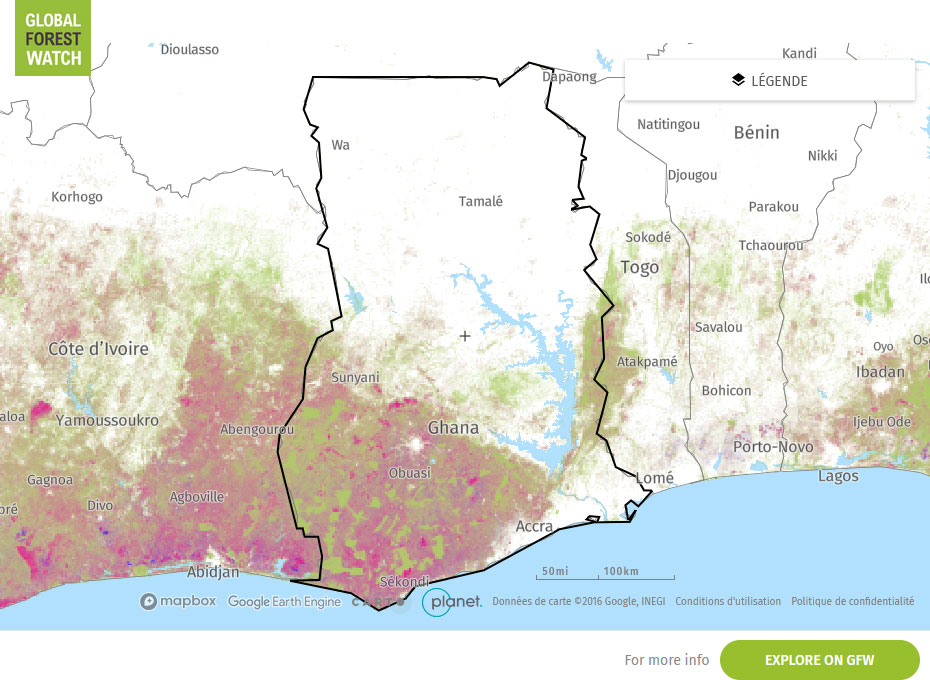
Global Forest Watch Map
RISK SCORES
|
CORRUPTION PERCEPTION INDEX (Transparency international) Corruption Perception Index 43/100
0 is highly corrupt, 100 is very clean. |
ILLEGAL DEFORESTATION AND ASSOCIATED TRADE (IDAT) Risk (Forest Trend) 59.20/100
00 is higher risk, 0 is lower risk
|
|
SOURCING HUB RISK SCORE (Preferred by nature) 35/100 0 is higher risk, 100 is lower risk
|
COUNTRY DEFORESTESTATION CLASSIFICATION LIST - EUDR (European Commission) LOW risk category For more information about the methodology, see here
|
Interpretation of Risk Indicators
Subnational variations in risks
| HARVESTING SOURCE | DUE DILIGENCE COMPLEXITY | DUE DILIGENCE CONSIDERATION |
|---|---|---|